To read this update in its original PDF format please click here
Memo to: MCJ Capital Partners
From: M. Carter Johnson
Re: Q2 2020 Performance Update
Date: 7/15/2020
Dear Partners & Friends,
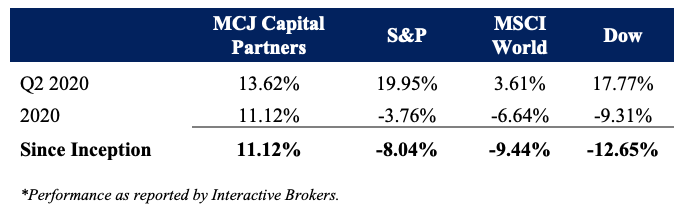
For Q2 of 2020 our total return was +13.62% compared to +19.95% for the broader S&P Index, +23.61% for the broader MSCI World index, and +17.77% for the Dow Jones Industrial Average.
Since inception (as marked as February 12, 2020), our total return is +11.12% compared to -8.04% for the broader S&P Index, -9.44% for the broader MSCI World index, and -12.65% for the Dow Jones Industrial Average.
Commentary on Q2
Overall, the broader markets experienced the best quarter in three decades due to the sharp bounce back from end of March lows. It does not surprise me in the least bit that we underperformed the broader markets in Q2. Going into Q2 we were in a defensive position. COVID-19 had just begun to significantly displace US business operations with a wave of shelter in place and temporary shutdown orders. Our plan was to buy shares of good companies on the way down as well as on the way up. In addition, our aim was to avoid any aggressive attempt to “time” the bottom of the market (not our skillset). Therefore, when the market bottomed and had a sharp rally, we missed a portion of those early gains. As the saying goes, the most expensive penny is the first at the bottom and the last at the top. It is my belief that if we stick to what we do best (finding good companies at fair prices), over the long run we will do much better than trying to time market inflection points.
Commentary on Positions
As you may or may not have noticed, we hold a number of “thinly” traded marketable securities. This is intentional. These are good companies largely inaccessible to many institutions and larger asset bases. Furthermore, passive solutions (which make up a large percentage of public market activity), cannot venture into these corners of the market, presenting bottom up investors like us with somewhat of an edge.
Understand that due to the illiquidity of these securities the pricing will often move in “chunks.” This means for long stretches of time the pricing will be dormant only to move in a sudden manner. This heightens the registered volatility of these securities making them perceived as “riskier” by financial academia standards. It is my belief that volatility is a relevant measure of risk for trading strategies but less relevant for fundamental investors with long-term holding horizons. Therefore if we understand the company and are confident in our analysis, we further our edge by holding positions like these with misunderstood risk profiles.
Why I mention all this is the impact it has on the marked value of your portfolio. On days when only a few shares trade hands, the price of these securities are marked as the last executed trade price. If no shares trade or the current bid ask spread is outside of the range of the last executed trade, the securities are marked at quoted bid ask price. When you look at your account, this can create a mixed sort of illusion in regards to the valuation reality. To illustrate my point take a look at Parks America. On a day last week, 200 shares of PRKA traded down $0.015 on the day. At the time this created a quoted decrease of -7.5% in market value or put differently, the company market cap was almost $1 million less. 200 shares trading down just $0.015 equates to -$3 in overall traded value. To say a $3 move took $1 million of value off the company is kind of hysterical when you vocalize it out loud…but that’s how it’s marked! Sometimes these “wiggles” pop right back into place, other times they linger a few days. I try to ignore these fluctuations (for us or against us) and focus only on the change in the intrinsic value. I would suggest you too attempt to ignore these little fluctuations and view ownership of these securities similar to owning a quasi-private company. I’m happy to elaborate on this topic should you have any questions.
Expectations Going Forward
I am very excited about the second half of 2020. While I perceive mid and large cap valuations to be somewhat frothy, I am finding what I believe to be very good companies at fair valuations in the local small and micro-cap markets, as well as abroad. We currently have five new companies in our vetting and due diligence process, all of which look promising. Should our analysis conclude these companies offer better long term opportunities than our current holdings, we will mix them into our portfolio and potentially rotate out our less competitive holdings.
Lastly, you may have noticed in mid-June I placed two short positions to hedge our portfolio. These positions were taken against respective ETFs of the Dow Jones Industrial Average and the S&P 500. Overall, including considerations to our cash position, this brings our net market exposure to around 88%. As to the reason for this, it is my goal to have us heavily invested in good companies trading at favorable valuations regardless of macro narratives. The majority of these businesses should appreciate in value through internal compounding of their earnings, expansion of their valuation multiples or a combination of the two. However, these positions will also “move” in part with the broader markets, in disregard to their operational performance. Having a hedge neutralizes a portion of impact the broader market has on these positions. This hedge allows me to focus on our edge of good analysis work with less regard to market “noise.” In other words, I sleep better knowing we can go out and aggressively buy good companies while being hedged against a portion of macro conditions.
I view our short positions to be a rudder assisting us in rough waters. As the environment changes, so too will our use of short positions.
As always, I’m thankful for the trust you have given me in being a steward of your capital. It energizes me knowing others believe in what we are trying to do at MCJ Capital Partners. I do not take the responsibility lightly and hope to keep improving to further our overall performance.
All the best,
M. Carter Johnson
The performance results shown are those of the first account under management of MCJ Capital Partners LLC (“MCJ”) and are the result of the application of MCJ’s proprietary investment process. These performance results are presented net of brokerage fees, and custodial fees. No management fee was charged in 2020. The performance results include the reinvestment of dividends and interest on cash balances where applicable.
All performance results are unaudited and are not an estimate of any specific investor’s actual performance, which may be materially different from such performance depending on numerous factors. No representations or warranties whatsoever are made by MCJ or any other person or entity as to the future profitability of an investment account or the results of making an investment. All information provided is for informational purposes only and should not be deemed as advice in relation to legal, taxation, or investment matters.
Each of the S&P 500 Index, the MSCI Index, and the Dow Jones Industrial Index (each, an “Index”) is an unmanaged index of securities that is used as a general measure of market performance, and its performance is not reflective of the performance of any specific investment. The Index comparisons are provided for informational purposes only and should not be used as the basis for making an investment decision. Further, the performance of an account managed by MCJ and each Index may not be comparable. There may be significant differences between an account managed by MCJ and each Index, including, but not limited to, risk profile, liquidity, volatility and asset comparison. The performance shown for each Index reflects no deduction for client withdrawals, fees or expenses. Accordingly, comparisons against the Index may be of limited use. Investments cannot be made directly into an Index.
The information contained herein reflects the current expectations and opinions of MCJ as of the date of publication, which are subject to change without notice at any time. MCJ does not represent that any expectation or opinion will be realized. While the information presented herein is believed to be reliable, no representation or warranty is made concerning the accuracy of any data presented. Neither MCJ nor any of its advisers, officers, directors, or affiliates represents that the information presented in this tear sheet is accurate, current or complete, and such information is subject to change without notice. No representations or warranties whatsoever are made by MCJ or any other person or entity as to the future profitability of an investment account or the results of making an investment.
Past performance is not indicative of future results.
Additional information is available from MCJ upon request. MCJ is not acting as your adviser or agent unless and until you and MCJ sign an investment advisory agreement.