To read this update in its original PDF format please click here
Memo to: MCJ Capital Partners
From: M. Carter Johnson
Re: Q2 2022 Performance Update
Date: 7/27/2022
Dear Partners & Friends,
For Q2 of 2022 our total return was -14.10% compared to -16.45% for the broader S&P Index, -15.74% for the MSCI World index, and -17.48% for the Russell 2000 index.[1]
Since inception (as marked February 12, 2020), our total return is +42.74% compared to +15.46% for the broader S&P Index, +6.12% for the MSCI World index, and +3.51% for the Russell 2000 index.

Thoughts and Commentary on Q2 2022
In May of 1946, the S&P traded at 21.74x earnings. Fast forward 76 years later, and at the end of June 2022, the S&P trades at an estimated 19.15x earnings. Over that time period, the earnings multiple has fluctuated as high as 123.73x and as low as 5.82x, but currently sits just 12% compressed from that May 1946 mark. And yet, had you invested $1,000 in May of 1946 your wealth would have swelled to just under $200,000 by the end of June 2022, all while taking on this valuation headwind of 12%.
So what changed? The obvious answer is earnings. Over that period it wasn’t an expansion of the valuation multiple that drove wealth creation, it was the compounding effect of economic earnings. In the short-term swings in valuation multiples can drive markets in all different directions. However, in the long-term, it’s the economic earnings that matter.
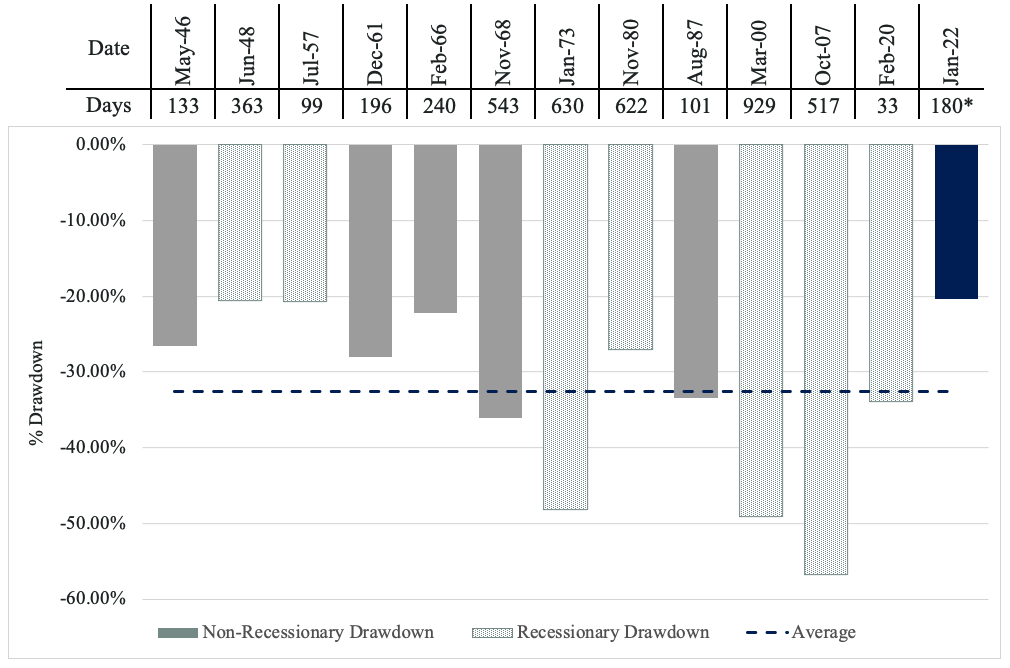
This is especially important to remember in the current environment. We find ourselves in a bear market, one of only 13 in the Post World War II era, and only the fourth of the 21st century. Using the time frame of the S&P post World War II, here’s what you should know about bear markets: the average bear market in that time period has lasted 367 days with the average peak to trough drawdown being 33.56%. The longest bear market was the bursting of the dotcom bubble, which lasted 929 days and saw a peak to trough drawdown of 49.1%. The shortest bear market (not including March 2020) lasted 99 days, and saw a peak to trough drawdown of 20.7%. The deepest bear market took place during the Great Financial Crises or “Great Recession,” when the index experienced a 56.8% drawdown. Using the January 3, 2022 market peak, to make this an average bear market, we’d still need to go down an additional 13%.
For most, bear markets are a grind. They’re generally filled with short lived rallies that yank the emotions of market participants every which direction. It’s my opinion that bear markets are particularly tough on the psyche for pure index investors. Investing in an index leaves one less inclined to “know what they own,” and can create more temptation to time market fluctuations as asset prices wiggle around. We have the advantage of knowing what we own. Even with the markets having their worst first half start since 1970, if we look through the portfolio to our actual businesses we can see most are growing their intrinsic value. Just a few examples:
This year RediShred Capital Corp has already acquired locations in Illinois, Florida, and New Jersey. The company reported 76% revenue growth and 106% EBITDA growth in the first quarter. In addition, RediShred continues to expand its scanning sales, with the business line seeing a 126% bump year over year.
Across the pond, Judges Scientific reported an increase of 14% in sales, with cash generated from operations soaring 34%. Even better, the company completed its largest acquisition in history, acquiring instrument manufacturing leader Geotek.
Our favorite grocer, Dino Polska, continues to offer the lowest cost and highest quality food to a Polish population that is swelling 10% from the fallout of the Ukraine / Russia conflict. Over the first half of 2022, the company opened nearly a store a day (162), bringing total location count to 1,975. In the most recent reporting period, Dino Polska posted sales growth of 39.6%, with EBITDA growth of 37.1%.
In the land down under, Kelly Partners Group Holdings continues to execute on its partner owner driver model acquiring 6 accounting firms with 9 operating locations in the first half of this year alone. Company sales are up 24.5% with profits up 18.3%.
And our favorite serial acquirer, Constellation Software, continues to crank its machine at a mind numbing rate. The company has completed over 30 acquisitions in the first half of the year, and is well on track to deploy more capital than any other year in its history.

When we focus on the business, the noise of everything else fades to the background.
Inflation, Bullwhips, Cobwebs, & What Comes Next
The current bear market was induced by a contraction in valuations. The Federal Reserve’s move to increase interest rates as part of general quantitative tightening efforts to control inflation. With interest rates going up, asset valuations go down. What is yet to be determined is if this bear market will remain purely a contraction of valuations, or transition to a reduction of earnings, thus potentially pulling asset prices even lower. To understand where we are and where we might be going on the earnings front, it’s helpful to refer to a few economic effects that are unfolding in real time.
When stimulus was pumped into the economy in 2020 it left too many dollars chasing too few goods. Consumers were limited from spending on services, and thus blitzed retailers for products to occupy and upgrade their shift to in home activities. This bump in purchasing triggered retailers to respond with order increases to wholesalers. Wholesalers seeing the demand from consumers and orders from retailers, turned to manufacturers to demand more inventory. To meet demand of wholesalers, manufacturers increased needed supply to create finished goods. And because supply inputs are raw materials, all this purchasing pressure shot commodity prices through the roof. Port congestion, trucking woes, and an overall exacerbated supply chain made demand at each level harder to read and forecast in real time. This entire phenomenon of inventory swings beginning with demand increase at the retail level and spanning across the supply chain is referred to as a bullwhip effect.
The problem with a bullwhip effect is it doesn’t just smooth out in one direction. Healthy functioning economies have supply and demand equilibrium where price volatility is typically low. This allows actors across supply chains and in various markets to plan and transact with confidence, knowing they’ll be pretty close to matching demand at best available prices. When the functioning of an economy is disrupted, supply and demand must recalibrate to find that equilibrium again. During this process price can become an accelerator or deterrent of demand depending on inventory levels. Surplus inventory leads to a reduction in price. A reduction in price causes a fall in supply. Lower supply then increases price. Higher price incentivizes new inventory to be brought to market, and we repeat the cycle over again. Each iteration swings supply and demand as the marketplace recalibrates to equilibrium. The entire phenomenon makes a cobweb pattern on the supply and demand curve, thus earning the name the “cobweb effect.”

We’re already seeing the cobweb effect play out in commodities, shipping rates, and inventory levels across the economy. Russia’s invasion of Ukraine only complicates the situation because of the concentrated agricultural and general commodity exposure in the region. As I mentioned, this bear market began as a contraction in valuations. While the marketplace recalibrates it’ll be harder for many businesses to accurately plan and price both their input needs as well as the demand for their products across different price points for their customers. In addition, tighter credit conditions and slower growth make for obvious headwinds. These factors very well could create volatility through many business operating models, thus jeopardizing earnings.
As It Relates To Our Companies
Our businesses aren’t immune to disruptions in the economy. However, I do believe at the portfolio level our collective group of companies are setup ideally for the current economic landscape. Two points of emphasis for your consideration:
Non-discretionary Expenses – You’ll notice the majority of our businesses focus on providing their customers with products and services classified as non-discretionary expenses. “Non-discretionary,” meaning the customer cannot delay, forgo, or substitute if they wish their business or life to continue as usual. Providing customers with non-discretionary products and services is favorable at any point of the cycle but especially beneficial when economic conditions tighten. The focus on “Expense” in non-discretionary expenses is just as important. Expense implies consumption in the short-term. These are not the same as expenditures, which imply capital investment (think larger outflows of cash) for consumption over long periods of time. When economic conditions tighten, the purchase behavior of discretionary expenditures disappear and non-discretionary expenditures are often delayed until economic storm clouds lift. However, expenses are rooted in day to day functionality of our businesses end customers. Expenses are trimmed but rarely removed altogether. Therefore, our bias towards owning companies that provide customers with these “non-discretionary expenses” should show great durability over this portion of the economic cycle.
Acquisitive Value Adders – It’s no secret I have heavy affection towards serial acquirers, especially those we deem “Acquisitive Value Adders.” I believe the current environment could not be stronger for these types of companies. In a rising interest rate environment, valuations fall and debt covenants tighten. As valuations fall, more companies are priced within hurdle rates of these acquisitive value adders with permanent capital bases. This allows serial acquirers to accelerate their capital deployment and realize higher returns on the acquired earnings. Simultaneously, buyers without a permanent capital base must navigate capital calls with murky economic sentiment, and tighter covenant conditions extended by lenders. This reduces the pool of overall buyers. In these waters, the serial acquirer with a deeper understanding of base rate performance on targets compared to their counterparts, can lean into their balance sheet to complete deals when others cannot.
While the markets churn, remember we own what we own for good reason. When prices go down on good businesses, it’s the expected future returns that go up.
Until next time,
M. Carter Johnson
**Original letter had MCJ Capital Partners net annualized as 18.14% this computation was corrected to 16.10%. VOO of 6.97% corrected to 6.22%, VT of 2.82% corrected to 2.52%, and VTWO of 1.63% corrected to 1.46%. Please contact Carter Johnson directly at the above email if you would like an original copy of this letter prior to the corrections.

1) The performance results shown are those of the first account under management of MCJ Capital Partners LLC (“MCJ”) and are the result of the application of MCJ’s proprietary investment process. These performance results are presented net of all fees including brokerage, margin, custodial, and a 1% management fee beginning in January 2021. No management fee was charged in 2020, all other fees were present. A client’s return with respect to an investment would be reduced by any fees or expenses a client may incur in the management of its investment advisory account, including advisory fees in the future. The performance results include the reinvestment of dividends and interest on cash balances where applicable.
All performance results are unaudited and are not an estimate of any specific investor’s actual performance, which may be materially different from such performance depending on numerous factors. No representations or warranties whatsoever are made by MCJ or any other person or entity as to the future profitability of an investment account or the results of making an investment. All information provided is for informational purposes only and should not be deemed as advice in relation to legal, taxation, or investment matters. Past performance is not indicative of future results.
Each of the S&P 500 Index, the MSCI Index, and the Russell 2000 Index (each, an “Index”) is an unmanaged index of securities that is used as a general measure of market performance, and its performance is not reflective of the performance of any specific investment. The Index comparisons are provided for informational purposes only and should not be used as the basis for making an investment decision. Further, the performance of an account managed by MCJ and each Index may not be comparable. There may be significant differences between an account managed by MCJ and each Index, including, but not limited to, risk profile, liquidity, volatility and asset comparison. The performance shown for each Index reflects no deduction for client withdrawals, fees or expenses. Accordingly, comparisons against the Index may be of limited use. Investments cannot be made directly into an Index. The S&P Index return was determined using the performance of Vanguard S&P 500 ETF (VOO). The MSCI Index return was determined using the performance of Vanguard Total World Stock ETF (VT). The Russell 2000 Index return was determined using the performance of Vanguard Russell 2000 ETF (VTWO).
MCJ offers investment advisory services and is registered with the state of Colorado. Registration does not constitute an endorsement of the advisory firm by the Colorado Securities Commissioner nor does it indicate that the advisory firm has attained a particular level of skill or ability. All content on this webpage is general in nature, not directed or tailored to any particular person, and is for informational purposes only. Neither this webpage nor its contents are offered as investment advice and should not be deemed as investment advice or a recommendation to purchase or sell any specific security. In addition, neither this webpage nor its contents should be construed as legal, tax, or other advice. Individuals are urged to consult with their own tax or legal advisers before entering into any advisory contract.
The information contained herein reflects the current expectations and opinions of MCJ as of the date of publication, which are subject to change without notice at any time. MCJ does not represent that any expectation or opinion will be realized. While the information presented herein is believed to be reliable, no representation or warranty is made concerning the accuracy of any data presented. Neither MCJ nor any of its advisers, officers, directors, or affiliates represents that the information presented in this tear sheet is accurate, current or complete, and such information is subject to change without notice. No representations or warranties whatsoever are made by MCJ or any other person or entity as to the future profitability of an investment account or the results of making an investment.
Past performance is not indicative of future results.
Additional information is available from MCJ upon request. MCJ is not acting as your adviser or agent unless and until you and MCJ sign an investment advisory agreement.
Readers are advised that the material herein should be used solely for educational purposes. This memorandum expresses the views of the author as of the date indicated and such views are subject to change without notice. MCJ Capital Partners LLC does not purport to tell or suggest which investment securities members or readers should buy or sell for themselves. Readers should always conduct their own research and due diligence and obtain professional advice before making any investment decision. MCJ Capital Partners LLC will not be liable for any loss or damage caused by a reader's reliance on information obtained in any of our newsletters, presentations, memorandums, special reports, email correspondence, or on our website. Our readers are solely responsible for their own investment decisions.
The information contained herein does not constitute a representation by the publisher or a solicitation for the purchase or sale of securities. Our opinions and analyses are based on sources believed to be reliable and are written in good faith, but no representation or warranty, expressed or implied, is made as to their accuracy or completeness. All information contained in our newsletters, presentations or on our website should be independently verified with the companies mentioned. The editor and publisher are not responsible for errors or omissions.
MCJ Capital Partners and accounts actively managed by MCJ Capital Partners have long positions in RediShred Capital Corp (KUT.V), Judges Scientific plc (JDG.L), Dino Polska S.A. (DNP.WSE), Kelly Partner Group Holdings (KPG.ASX), and Constellation Software Inc (CSU.T) and would benefit from overall price appreciation of the stock. At any time we may close any of these position without notice.