To read this update in its original PDF format please click here
Memo to: MCJ Capital Partners
From: M. Carter Johnson
Re: Q3 2021 Performance Update
Date: 10/31/2021
Dear Partners & Friends,
For Q3 of 2021 our total return was +0.77% compared to +0.22% for the broader S&P Index, -1.72% for the MSCI World index, and -4.49% for the Russell 2000 index.[1]
Since inception (as marked February 12, 2020), our total return is +92.03% compared to +31.27% for the broader S&P Index, +26.61% for the MSCI World index, and +33.85% for the Russell 2000.

Thoughts and Commentary on Q3 2021
What a fascinating time it is in both markets and the broader global economy. Just off the coast of Los Angeles, views of the Pacific Ocean are littered with shipping vessels waiting for a turn to unload their cargo. From logistics to healthcare to manufacturing to service sectors, labor is constantly cited as the issue that stands in the way of filling demand. Prices are on the rise, setting up U.S. Social Security benefits to jump 5.9% in 2022, a record last matched 40 years ago. In China and Europe, rolling energy crises are disrupting “business as usual” mudding general growth and short-term ESG initiatives. While the booms in commodity prices are subsiding they still buoy at levels making cost inputs a deterrent on demand. And as central banks across the globe begin to tighten, the bond market seems to be buying more of a stagflation narrative than anything else.
Like I said, a fascinating time.
While macro is a fun thought exercise, our focus is and will continue to be on finding good companies at fair prices. A portfolio of good companies gives us the ability to weather the variations of macro conditions throughout cycles. Depending on the point of the cycle, some of our businesses will shine and some will falter, but overall good companies tend to prevail and grow their intrinsic value in the process. This past quarter it was enjoyable to see the construction of our portfolio work in real time. The market priced some of our companies higher and some lower, ultimately leaving us with a collective mark-to-market value near where we ended in Q2 of 2021.
Commentary on Our Companies
In our 2020 EOY Update (released January 15, 2021) I mentioned three of our companies – Parks! America, Creightons PLC, and Constellation Software. All three companies have had an exceptional year in terms of both operating performance and overall share price return. While I’m happy to discuss any of these companies with you, I’ll use this update as an opportunity to explain more of what is transpiring at Creightons PLC.
Bernard Johnson and the Creightons team continue to deliver. Creightons is coming off a wonderful reporting period. Year over year sales are up 28.9% and diluted earnings per share climbed 35%. However, that’s not what excites us.
We believe Creightons is entering a phase in which the company will simultaneously accelerate sales while expanding overall operating margins. To understand this prospective let’s take a walk through the business...
Creightons sales mix spans three lines of business. The first line is private label sales. This is where retailers and super markets hire Creightons to manufacture their private label products. It’s a good line of business and does well in counter cyclical environments when consumers become more price conscious. The second line of business is contract manufacturing. This is where brands hire Creightons to develop and manufacture a product on their behalf. This business is decent but has higher customer turnover as successful brands eventually bring manufacturing functions in house. The third line of business is branded sales. These are products Creightons develops, test, manufactures, markets, and distributes all under different brands and to different customer bases, but fully owned and part of the Creighton product portfolio. The entire three prong approach does a wonderful job of diversifying revenue sources and stabilizing Creightons’ overall business. However, it’s this third line of business that is particularly advantageous.
Currently sales of Creightons’ branded portfolio tally just £12 million, making up a little over 19% of total revenue. We believe this is about to change drastically…
Over the last several years management has been quietly improving the overall business. Leadership cut low performing brands to consolidate focus on high performers. Management targeted better customers with higher margins. Production lines were expanded and optimized. As the top line improved, the benefits of scale began to show. Overall, this has led to a consistent uptick in operating margins despite added costs associated with the Pandemic chipping away approximately 200 bps of margin.

Collectively these efforts have strengthened Creightons’ platform. A platform we believe will prioritize current Creightons brand lines, and allow the company to methodically launch, acquire, and further grow a branded product portfolio in the beauty and personal care space.
The growth in branded sales will largely be a result of company efforts to transition from brick and mortar retail to ecommerce sales and distribution. Last year global online sales in self-care surged 59% year over year. Hair care products swelled 60%, face care 47%, and body care 89%, with organic brands growing another 56%.[2] These are all product bases in Creightons wheelhouse. Low shipping unit cost, sticky recurring customer bases and low return volume make ecommerce a viable sales channel for personal care products . The problem for many brands in this highly fragmented industry is their operations are too small to leverage the operating backend that’s required to meet placement credentials on big ecommerce beauty retail sites. To preserve quality of products offered, the big online beauty retailers require certain levels of sells support, a social media follower threshold count and other hurdles that ultimately are out of reach for smaller brands.
However, Creightons is of a Goldilocks size. Creightons is small enough where niche product lines can move the needle, but big enough where it can leverage backend scale to invest and push brands into rapid growing sells and distribution channels. In the 2020 calendar year, the company began aggressively building the ecommerce strategy. The first step was bringing on an ecommerce executive with extensive experience in building brands online. The company also created and filled three new brand management positions, a sales rep for the country of Germany, and setup a dedicated inhouse team solely for Amazon. As for ecommerce retail placement, 2020 (calendar year) was the start of Creightons using Amazon (better late than never), and this year has multiple brands rolling out on beauty ecommerce retailers such as Next Beauty, Boots, Feelunique, Superdrug, and Marks and Spencer. Early efforts have paid off. Digital branded sales jumped 5.6x, and at a total amount of just £1.4 million, we believe this is just the start of a very long runway.

In addition to ecommerce efforts, Creightons can use its Goldilocks size to move the needle with small accretive acquisitions. These small brands would be of no use for major players like Unilever, but are just the right size to benefit from Creightons’ platform. Over the 2021 calendar year the company has completed two acquisitions of this type; Emma Hardie and Brodie and Stone. To understand the benefits of Creightons’ platform from an acquisitive perspective, let’s walk through the Emma Hardie deal...
Emma Hardie is a premium positioned skincare brand. The company offers a range of luxury skincare products and has ecommerce placement on Look Fantastic, Feel Unique and Amazon Premium Beauty. Emma Hardie was looking for a buyer who could help with expansion into international markets while upholding the brands strong ingredients standards (10 – 15 natural ingredients in each product).
Creightons was immediately appealing because of their ability to handle difficult natural ingredients, and their reputation as a manufacturer of organic products (Creightons is also the oldest cruelty free U.K. manufacturer). Under Creightons ownership, Emma Hardie could retain its ingredient standard while lowering its input cost. In addition, the company could utilize Creightons R&D department and product portfolio to extend the Emma Hardie brand across more product categories. Under Creightons, Emma Hardie saves on procurement and manufacturing, extends their product range, and scales their sales distribution through Creightons current retail footprint. Creightons paid £6.4 million for the company in a year Emma Hardie was doing £3.8 million in sales, with £0.2 million EBITDA (5.3% margins). Management believes plugging Emma Hardie into legacy retail channels will add 20% to sales in the first year. In addition using Creightons procurement, manufacturing, and distribution are estimated to save Emma Hardie £0.6 - £0.8 million. Collectively this would bring Emma Hardies EBITDA margins near 20%, well above Creightons current 11.2%. A win-win for both companies.
The appeal of Creightons is having this platform in place while being of a Goldilocks size. The company’s big enough to benefit from economies of scale but small enough to move the needle with little acquisitions and inhouse brand creation. Each new added brand diversifies the overall brand portfolio and strengthens Creightons as a whole, yet none put the company in a “make or break” position.

What Happens Next: Creightons will be reporting the first half of Fiscal 2022 this November (2021). We anticipate Hygiene Sales to fall off completely. Anything less would be a gift. These are hand sanitizer sales largely driven by contracts with United Kingdom National Health Service (NHS). When this is reported, the company will screen “ugly” year over year comps. If we are lucky, Mr. Market will dump shares with focus on the short-term numbers with misunderstanding of the big picture and long-term opportunity. As owners with a long-term focus, we welcome irritational dips in share price as it gives us advantageous buying opportunities.
Pounds, Shilling, Pence and a little history...
Since we are on the topic of UK companies, I thought I would share a question. A few weeks ago one of our investors asked me "why do UK equities trade at such high price points?" It's a great question brought on by a little confusion, especially if you're less familiar with foreign exchanges.
Here's what's going on... In most countries equities are quoted in their native major currency unit. For example in the United States we have dollars, quarters, dimes, nickels, and pennies. A share trading at $22 and 54 cents, is quoted as $22.54. However, in the UK, equities are actually quoted in pence, or the equivalent of the British penny. An equity on the LSE trading at £22 and 54 pence would actually be quoted as 2254p, and not £22.54. If you look at a portfolio and see just the quoted number of a UK security, it *appears* quite pricey compared to its international peers.
This all stems from the UK's decimalization of the pound in 1971. Prior to decimalizing the currency, one pound referred to one pound of sterling silver coins (hints to the name sterling pound). Each pound equated to 20 shillings. Each shilling equated to 12 pence. Effectively one pound equaled 240 pence. This made quoting securities to the last sub-unit of the currency highly difficult, with the only real solution to mark spreads in fractions. Ultimately Decimal Day on February 15, 1971 abolished the shilling, with the pound being subdivided into 100 "new pence."
That the LSE still quotes in pence versus pounds today is mostly due to the technology headache of replacing an embedded legacy systems. This has only been magnified with algo trading, and passive portfolio solutions. The discrepancy in how LSE quotes in the smallest unit of currency actually has been prone to create error for shops less familiar with the format. For example, if Constellation Software is trading on the TSX at 2,200 and Diploma PLC is trading on the LSE at 3,100, you can easily misvalue the positions jumping ahead to a CD/USD and GBP/USD conversion prior to adjusting for Diploma's quote being in pence and not pounds. Even more detrimental, if you follow smaller thinly traded UK securities, inevitably you'll see a few times each year a trade execute at 1/100th of the intended price. This happens when someone less familiar with the LSE procedure intends to enter a trade at say £22.54 and instead places it for 22.54 pence, versus the correct entry of 2254p.
Of course all of this plays no effect on the intrinsic value of the company. It's just interesting to know. If anything, the next time you find yourself at a trivia night and the moderator ask "which country has the largest concentration of penny stocks?" You can cleverly respond “that would be the United Kingdom, of course.”
Until next time,
M. Carter Johnson
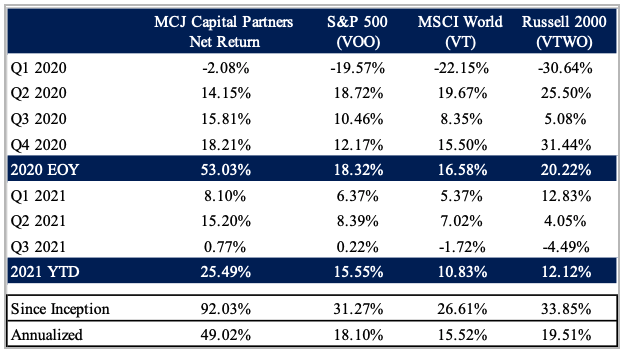
1) The performance results shown are those of the first account under management of MCJ Capital Partners LLC (“MCJ”) and are the result of the application of MCJ’s proprietary investment process. These performance results are presented net of all fees including brokerage, margin, custodial, and a 1% management fee beginning in January 2021. No management fee was charged in 2020, all other fees were present. A client’s return with respect to an investment would be reduced by any fees or expenses a client may incur in the management of its investment advisory account, including advisory fees in the future. The performance results include the reinvestment of dividends and interest on cash balances where applicable.
All performance results are unaudited and are not an estimate of any specific investor’s actual performance, which may be materially different from such performance depending on numerous factors. No representations or warranties whatsoever are made by MCJ or any other person or entity as to the future profitability of an investment account or the results of making an investment. All information provided is for informational purposes only and should not be deemed as advice in relation to legal, taxation, or investment matters. Past performance is not indicative of future results.
Each of the S&P 500 Index, the MSCI Index, and the Russell 2000 Index (each, an “Index”) is an unmanaged index of securities that is used as a general measure of market performance, and its performance is not reflective of the performance of any specific investment. The Index comparisons are provided for informational purposes only and should not be used as the basis for making an investment decision. Further, the performance of an account managed by MCJ and each Index may not be comparable. There may be significant differences between an account managed by MCJ and each Index, including, but not limited to, risk profile, liquidity, volatility and asset comparison. The performance shown for each Index reflects no deduction for client withdrawals, fees or expenses. Accordingly, comparisons against the Index may be of limited use. Investments cannot be made directly into an Index. The S&P Index return was determined using the performance of Vanguard S&P 500 ETF (VOO). The MSCI Index return was determined using the performance of Vanguard Total World Stock ETF (VT). The Russell 2000 Index return was determined using the performance of Vanguard Russell 2000 ETF (VTWO).
MCJ offers investment advisory services and is registered with the state of Colorado. Registration does not constitute an endorsement of the advisory firm by the Colorado Securities Commissioner nor does it indicate that the advisory firm has attained a particular level of skill or ability. All content on this webpage is general in nature, not directed or tailored to any particular person, and is for informational purposes only. Neither this webpage nor its contents are offered as investment advice and should not be deemed as investment advice or a recommendation to purchase or sell any specific security. In addition, neither this webpage nor its contents should be construed as legal, tax, or other advice. Individuals are urged to consult with their own tax or legal advisers before entering into any advisory contract.
The information contained herein reflects the current expectations and opinions of MCJ as of the date of publication, which are subject to change without notice at any time. MCJ does not represent that any expectation or opinion will be realized. While the information presented herein is believed to be reliable, no representation or warranty is made concerning the accuracy of any data presented. Neither MCJ nor any of its advisers, officers, directors, or affiliates represents that the information presented in this tear sheet is accurate, current or complete, and such information is subject to change without notice. No representations or warranties whatsoever are made by MCJ or any other person or entity as to the future profitability of an investment account or the results of making an investment.
Past performance is not indicative of future results.
Additional information is available from MCJ upon request. MCJ is not acting as your adviser or agent unless and until you and MCJ sign an investment advisory agreement.
Readers are advised that the material herein should be used solely for educational purposes. This memorandum expresses the views of the author as of the date indicated and such views are subject to change without notice. MCJ Capital Partners LLC does not purport to tell or suggest which investment securities members or readers should buy or sell for themselves. Readers should always conduct their own research and due diligence and obtain professional advice before making any investment decision. MCJ Capital Partners LLC will not be liable for any loss or damage caused by a reader's reliance on information obtained in any of our newsletters, presentations, memorandums, special reports, email correspondence, or on our website. Our readers are solely responsible for their own investment decisions.
The information contained herein does not constitute a representation by the publisher or a solicitation for the purchase or sale of securities. Our opinions and analyses are based on sources believed to be reliable and are written in good faith, but no representation or warranty, expressed or implied, is made as to their accuracy or completeness. All information contained in our newsletters, presentations or on our website should be independently verified with the companies mentioned. The editor and publisher are not responsible for errors or omissions.
MCJ Capital Partners and accounts actively managed by MCJ Capital Partners have long positions in Creightons PLC (CRL), Parks! America (PRKA), Constellation Software (CSU), and Diploma PLC (DPLM) and would benefit from overall price appreciation of the stocks. At any time we may close any of these position without notice.
[2] 1010 DataServices ecommerce beauty spotlight report