To read this update in its original PDF format please click here
Memo to: MCJ Capital Partners
From: M. Carter Johnson
Re: Q3 2023 Performance Update
Date: 10/31/2023
Dear Partners & Friends,
For Q3 of 2023 our total return was -10.84% compared to -3.58% for the broader S&P Index, -3.92% for the MSCI World index, and -5.53% for the Russell 2000 index.[1]
Since inception (as marked February 12, 2020), our total return is 43.25% compared to 30.71% for the broader S&P Index, 15.85% for the MSCI World index, and 8.16% for the Russell 2000 index.

Thoughts and Commentary on Q3 2023
As previously mentioned in prior updates, our portfolio is primarily made up of smaller companies and international holdings. Looking back roughly 40 years, only in the dotcom bubble has small been cheaper on a relative basis to their large-cap counterparts. On the international front, the MSCI all country excluding U.S. listings, trades at a 30.5% discount to the S&P 500, or a little less than two standard deviations from the historic norm. Needless to say, we own asset groups that continue to be unbeloved by the broader markets and categorically have been pushed to the cheapest levels witnessed in recent history.

Source: BofA US Equity & Quant Strategy, FactSet

Source: Source: FactSet, MSCI, Standard & Poor's, J.P. Morgan Asset Management. Guide to the Markets – U.S. Data are as of September 30, 2023.
If you recall, in March of 2022 the Federal Reserve began raising rates. I mention this because as a general rule of thumb, interest rates typically take around five quarters to spread through the economy. This puts us still in the early phases of assessing what impact higher rates will have on the U.S. economy.

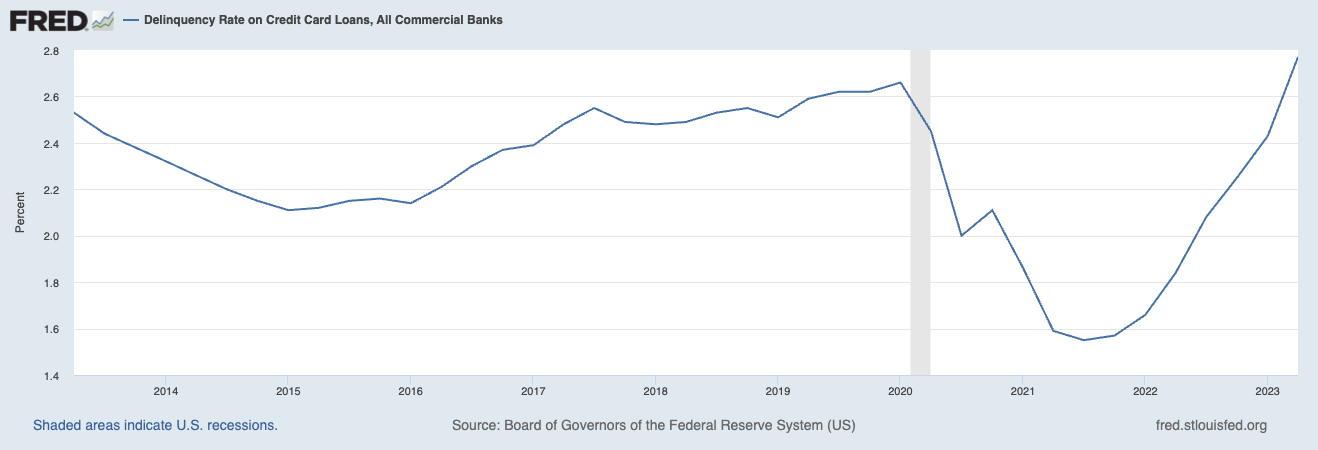
Coincidentally, this timing coincides with the colossal obligations of student loan repayments coming back online. Consider for a moment that U.S. consumer spending makes up a little over 70% of America’s GDP. An approximate 43 million individuals hold $1.7 trillion in student loan debt. Depending on which tracking organization you believe, monthly payments per individual average between $200 to $500, with most experts anchoring to $400 per month. That amounts to roughly $17.2 billion monthly, or $206.4 billion annually. For comparison at the end of September, total U.S. GDP was on track to grow 2.1% or a little over $534 billion this year. As to how resilient the U.S. consumer is, that question may be answered sooner rather than later. Since the Pandemic, savings rates for citizens of developed nations such as Japan, the United Kingdom, Canada, and most of Europe have persistently averaged between 6.5 – 10% of personal disposable income. U.S. citizens mimicked the behavior at the start of the Pandemic, however abandoned the habit around the start of 2022. As of the latest reading, the U.S. personal savings rate has now drifted further down to just 3.9% of personal disposable income. Simultaneously, trouble seems to be brewing with growing credit card balance. The most recent reading of credit card delinquencies shows not only are delinquencies rising, but they’ve surpassed the pre-pandemic mark.
All this to say, if interest rates are just now hitting the economy, a $200 billion headwind in debt payments is just coming online, household savings are drifting lower, and credit card delinquencies are rising, is it possible the U.S. consumer isn’t as well as headlines would have you believe?
Updates On Our Companies
As I’ve mentioned in past updates, during our good quarters and bad, regardless of how the marketable securities of our companies are performing, I encourage you to focus on the underlying businesses we own and how they continue to grow (or shrink) their intrinsic value.
Constellation Software Inc (CSU.TO) - Outside of Copart, our shares of Constellation Software have been the best performers of the year. However, it’s the progress of Constellation Software’s acquisition machine that we should be excited about. Constellation Software continues to defy the gravitational rules of modern-day capital allocation. As of September, CSU has deployed over $2 billion on acquisitions this year, exceeding the $1.7 billion total last year. The company is showing agility, completing deals as large as a quarter of a billion dollars and as small as one million. If you look closely at your account you’ll notice a funny little ticker that goes by “CSU.WTS.” These are rights issued to CSU shareholders for a CSU debt instrument. Mark Leonard has always championed priority for the CSU shareholder base to have first participation in capital raises offered by the company, which is why we were given these rights. The debt that these rights entitle one to are hybrid instruments that offer 6.5% plus the overall change in inflation. To our applauds as equity owners, the debt requires no asset pledges, no covenants, and should it be needed, CSU can stop paying interest on the debentures. You may be asking why would someone would want to hold these debt instruments. For debt investors CSU offers an attractive diversified cashflow stream along with the same tenants we’re fond of as equity investors of the company. As to the value for us, these rights trade about at the cost of what it would take for us to liquidate them. Considering we only deal with equity at this moment, we’ll let our rights expire and take pleasure in knowing the debt raise is likely indicative of confidence the Constellation team has in continuing to deploy capital in the acquisition machine, and at such high rates of return.
Redishred Capital Corp (KUT.V) - Redishred continues to execute its business model while shares of the company take a pummeling from the market. What’s driving the sentiment in share price? It’s not the record quarter the business reported in August. The culprit seems to be the price of recycled sorted office paper, which is down a little over 50% compared to this time last year. The business model of Redishred allows for proceeds from recycled paper to drop to the bottom line. When prices for paper are high, Redishred benefits. When prices for paper are low, the company is more dependent on the core service offerings of shredding to generate profits. This characteristic isn’t limited to just Redishred, it’s present for most operators in the paper shredding industry. However, what is unique to Redishred that you won’t find in other operators, is the company’s active acquisition strategy. During the trough cycle of paper prices, independent operators feel equal pain of depressed cash flows originating from the lack thereof pricing for recycled paper. This allows Redishred to accelerate its consolidation of route territories as valuations normalize and sellers are more realistic about what prices they’ll sell their business. In a way, Redishred has a counterbalance to the cyclical exposure of recycled paper exposure. The operations benefit when paper prices are high, and capital allocation benefits when paper prices are low. Higher paper prices equal higher profit margins. Lower paper prices equal faster growth of territory consolidation. The company has already made acquisitions in both New Jersey and Baltimore this year, and it would be surprising if at least one more acquisition wasn’t completed by year-end.
If we like the business of Redishred, there’s another reason we should welcome the sell-off in share price. Back in May of this year, management announced a share repurchase plan of up to 10% of the total company. This gives management another lever in the capital allocation toolbox. There are some technicalities, because Redishred trades on the TSX Venture Exchange, the company is limited to purchasing 25% of the average daily trading volume. As of the current market price, the company trades well below a takeout value that similar businesses in the paper shredding vertical have fetched over the years. We’ll hope private equity buyers aren’t paying attention, as Redishred is much more appealing for us to own as a way to compound capital over the long run versus benefiting from a one-and-done special situation takeout.
Judges Scientific PLC (JDG.L) - Across the pond, our U.K. company, Judges Scientific continues to execute well. As a reminder, Judges Scientific is a serial acquirer of high-quality scientific instruments. The company benefits from two strong tailwinds, the first being the growing global student population base, and the second being the worlds never-ending quest to optimize. The marketplace for scientific instruments is interesting. Intuitively you would expect a cyclical pattern as most institutions delay or forgo capital expenditures (ie sales for Judges Scientific equipment) during tough economic times. However, with scientific instruments, not having the latest and greatest instruments can quickly make a lab obsolete. If your equipment can only measure to 100 nanometers, but your competitor can measure to 1,000 nanometers, business often flows to the higher precision player. This dynamic creates an arms race of sorts where eventually delayed sales are recouped from prior budget cutbacks. The key as a manufacturer (or owner of multiple manufacturers) is staying relevant with new technology and equipment innovations, ready to fill orders when they come in.
Last year David Cicurel and team pulled the trigger on the largest acquisition in the company’s 21-year history, purchasing Geotek Ltd for £80 million. Geotek has been around for over 30 years and specializes in high-resolution, non-destructive analysis of geological cores. The company is a leader in its field with interesting applications and end markets such as nuclear waste depositories. This year, Judges Scientific continues to add to its moat of scientific instrument businesses with two purchases, Henniker and Bossa Nova Vision (BNV). Paying 4x EBIT, Henniker was purchased for £1.8 million and is a manufacturer of plasma deposition instruments. BNV was also purchased at 4x EBIT, but for $1.6 million. BNV manufactures imaging measurement instruments for the cosmetic industry and is complementary to Judges Scientific portfolio company Dia-Stron (which was purchased in 2016). Altogether, Judges Scientific now has 22 independent companies. Organic growth is ticking along at 16.2% year over year, once again proving the value in Mr. Cicurel strategy of patiently waiting to allocate capital to purchase higher quality businesses when available at reasonable prices.
Kneat.com Inc (KSI.TO) – Kneat is a company I have yet to publicly write about. The business is based out of Ireland, and led by the three founders, with Eddie Ryan serving as CEO, Brian Ahearne serving as CIO and Kevin Fitzgerald serving as CPO. At just around $225 million market cap, the company flies below the attention level for most institutional investors. Kneat is solving an interesting and costly problem, automating electronic validation workflow and document management for highly regulated industries. When a healthcare company manufactures a product, extensive testing is required to ensure an internal quality threshold is maintained. This testing is done across all processes on every machine and manufacturing line, throughout all systems of the company. The testing is routine and results must be captured, documented, and made available for regulatory audits. Most companies have to keep records for 20+ years and manage this process through carbon copies in physical form (and you thought your filing cabinet was a mess!). The stakes are high for these companies as a mishap of any form in the captured data, inadequate documentation, or ability to recall the captured results, pushes the company out of compliance. Kneat is the first end-to-end complete electronic solution that solves this problem and can be viewed across the entire company. Customers of Kneat can generate highly detailed, compliant reports in real time, with a complete audit trail for regulatory bodies such as the FDA. What makes Kneat specifically interesting is the system is built for data quality within the document and not just the document itself. Most validation systems rely on intake and upload into the system. Kneat validation is the system which not only reduces redundancy but maintains a higher level of data integrity. In addition, the functionalities being built within Kneat allow for data analytics that can incorporate insight from a company’s legacy system (ie paper) as well as the new documentation going forward.
Since landing its first customer (Biogen) in 2016, Kneat has gone on to corner the top 20 Global Pharmaceutical companies, now calling the majority their customers. The company has a first-mover advantage, with each additional customer providing further user proof of the product, and gateways into segmented suppliers and customers of the value chain. Kneat’s beachfront into the market was Pharma, but the company is already being sought after by other life science companies, consumer packaged goods, and contract manufacturing organizations.
In Closing
One of my favorite books is The Practicing Mind, by Thomas Sterner. It’s a short read, packed with wisdom regarding patience and relentless focus on the process. In it, Sterner tells a story about an Olympic archery coach who outlines the difference between American team archers and the Asian team archers. The passage I always come back to:
“It was as if they were drawing the bow and releasing the arrow only to hit the bull’s-eye and earn a good score. This was in contrast to the Asian teams, who, having grown up in different cultures, were consumed in the process of properly executing the technique that led up to releasing the shot. Where the arrow hit the target was almost unimportant compared to the motion of drawing the bow correctly and releasing the shot.”
I think about this story often and the parallels it has to investing. We need to check our arrows and make sure more often than not their hitting their targets. However, it’s that relentless focus on the process that betters our chances over the long run of having our arrows hit their target in the first place.
We’ll keep focusing on our process.
Until next time,
M. Carter Johnson

1) The performance results shown are those of the first account under management of MCJ Capital Partners LLC (“MCJ”) and are the result of the application of MCJ’s proprietary investment process. These performance results are presented net of all fees including brokerage, margin, custodial, and a 1% management fee beginning in January 2021. No management fee was charged in 2020, all other fees were present. A client’s return with respect to an investment would be reduced by any fees or expenses a client may incur in the management of its investment advisory account, including advisory fees in the future. The performance results include the reinvestment of dividends and interest on cash balances where applicable.
All performance results are unaudited and are not an estimate of any specific investor’s actual performance, which may be materially different from such performance depending on numerous factors. No representations or warranties whatsoever are made by MCJ or any other person or entity as to the future profitability of an investment account or the results of making an investment. All information provided is for informational purposes only and should not be deemed as advice in relation to legal, taxation, or investment matters. Past performance is not indicative of future results.
Each of the S&P 500 Index, the MSCI Index, and the Russell 2000 Index (each, an “Index”) is an unmanaged index of securities that is used as a general measure of market performance, and its performance is not reflective of the performance of any specific investment. The Index comparisons are provided for informational purposes only and should not be used as the basis for making an investment decision. Further, the performance of an account managed by MCJ and each Index may not be comparable. There may be significant differences between an account managed by MCJ and each Index, including, but not limited to, risk profile, liquidity, volatility and asset comparison. The performance shown for each Index reflects no deduction for client withdrawals, fees or expenses. Accordingly, comparisons against the Index may be of limited use. Investments cannot be made directly into an Index. The S&P Index return was determined using the performance of Vanguard S&P 500 ETF (VOO). The MSCI Index return was determined using the performance of Vanguard Total World Stock ETF (VT). The Russell 2000 Index return was determined using the performance of Vanguard Russell 2000 ETF (VTWO).
MCJ offers investment advisory services and is registered with the state of Colorado. Registration does not constitute an endorsement of the advisory firm by the Colorado Securities Commissioner nor does it indicate that the advisory firm has attained a particular level of skill or ability. All content on this webpage is general in nature, not directed or tailored to any particular person, and is for informational purposes only. Neither this webpage nor its contents are offered as investment advice and should not be deemed as investment advice or a recommendation to purchase or sell any specific security. In addition, neither this webpage nor its contents should be construed as legal, tax, or other advice. Individuals are urged to consult with their own tax or legal advisers before entering into any advisory contract.
The information contained herein reflects the current expectations and opinions of MCJ as of the date of publication, which are subject to change without notice at any time. MCJ does not represent that any expectation or opinion will be realized. While the information presented herein is believed to be reliable, no representation or warranty is made concerning the accuracy of any data presented. Neither MCJ nor any of its advisers, officers, directors, or affiliates represents that the information presented in this tear sheet is accurate, current or complete, and such information is subject to change without notice. No representations or warranties whatsoever are made by MCJ or any other person or entity as to the future profitability of an investment account or the results of making an investment.
Past performance is not indicative of future results.
Additional information is available from MCJ upon request. MCJ is not acting as your adviser or agent unless and until you and MCJ sign an investment advisory agreement.
Readers are advised that the material herein should be used solely for educational purposes. This memorandum expresses the views of the author as of the date indicated and such views are subject to change without notice. MCJ Capital Partners LLC does not purport to tell or suggest which investment securities members or readers should buy or sell for themselves. Readers should always conduct their own research and due diligence and obtain professional advice before making any investment decision. MCJ Capital Partners LLC will not be liable for any loss or damage caused by a reader's reliance on information obtained in any of our newsletters, presentations, memorandums, special reports, email correspondence, or on our website. Our readers are solely responsible for their own investment decisions.
The information contained herein does not constitute a representation by the publisher or a solicitation for the purchase or sale of securities. Our opinions and analyses are based on sources believed to be reliable and are written in good faith, but no representation or warranty, expressed or implied, is made as to their accuracy or completeness. All information contained in our newsletters, presentations or on our website should be independently verified with the companies mentioned. The editor and publisher are not responsible for errors or omissions.
MCJ Capital Partners and accounts actively managed by MCJ Capital Partners have long positions in Constellation Software (CSU.TO), RediShred Capital Corp (KUT.V), Judges Scientific PLC (JDG.L), Kneat.com (KSI.TO) and Copart (CPRT) and would benefit from overall price appreciation of the stocks. At any time we may close these positions without notice.